

PI: Carles Escera
The Frequency-Following Response (FFR) is a fascinating minute brain potential that captures with great fidelity the tracking accuracy of periodic sound features in the auditory midbrain and thalamus as sound evolves in time. With the FFR one can read (and hear!) subcortical neural traces from the human scalp as sounds are transcribed in subcortical neuronal aggregates, and show how these soundtraces are shaped by experience and context (see Escera, 2017). The Brainlab has used the FFR to show subcortical prediction errors (Slabu et al., 2012; read more…), the involvement of the serotonin transporter gene in accurate subcortical speech encoding (Selinger et al., 2016; read more…) and that timing predictability enhances subcortical regularity encoding (Gorina-Careta et al., 2016; read more…).
 In collaboration with Sant Joan de Déu Barcelona Children’s Hospital (Dra. M.D. Gómez-Roig), our current endeavor aims at deciphering how speech sounds are encoded in the neonate’s brain and whether defective neuronal speech encoding can predict neurocognitive impairment.
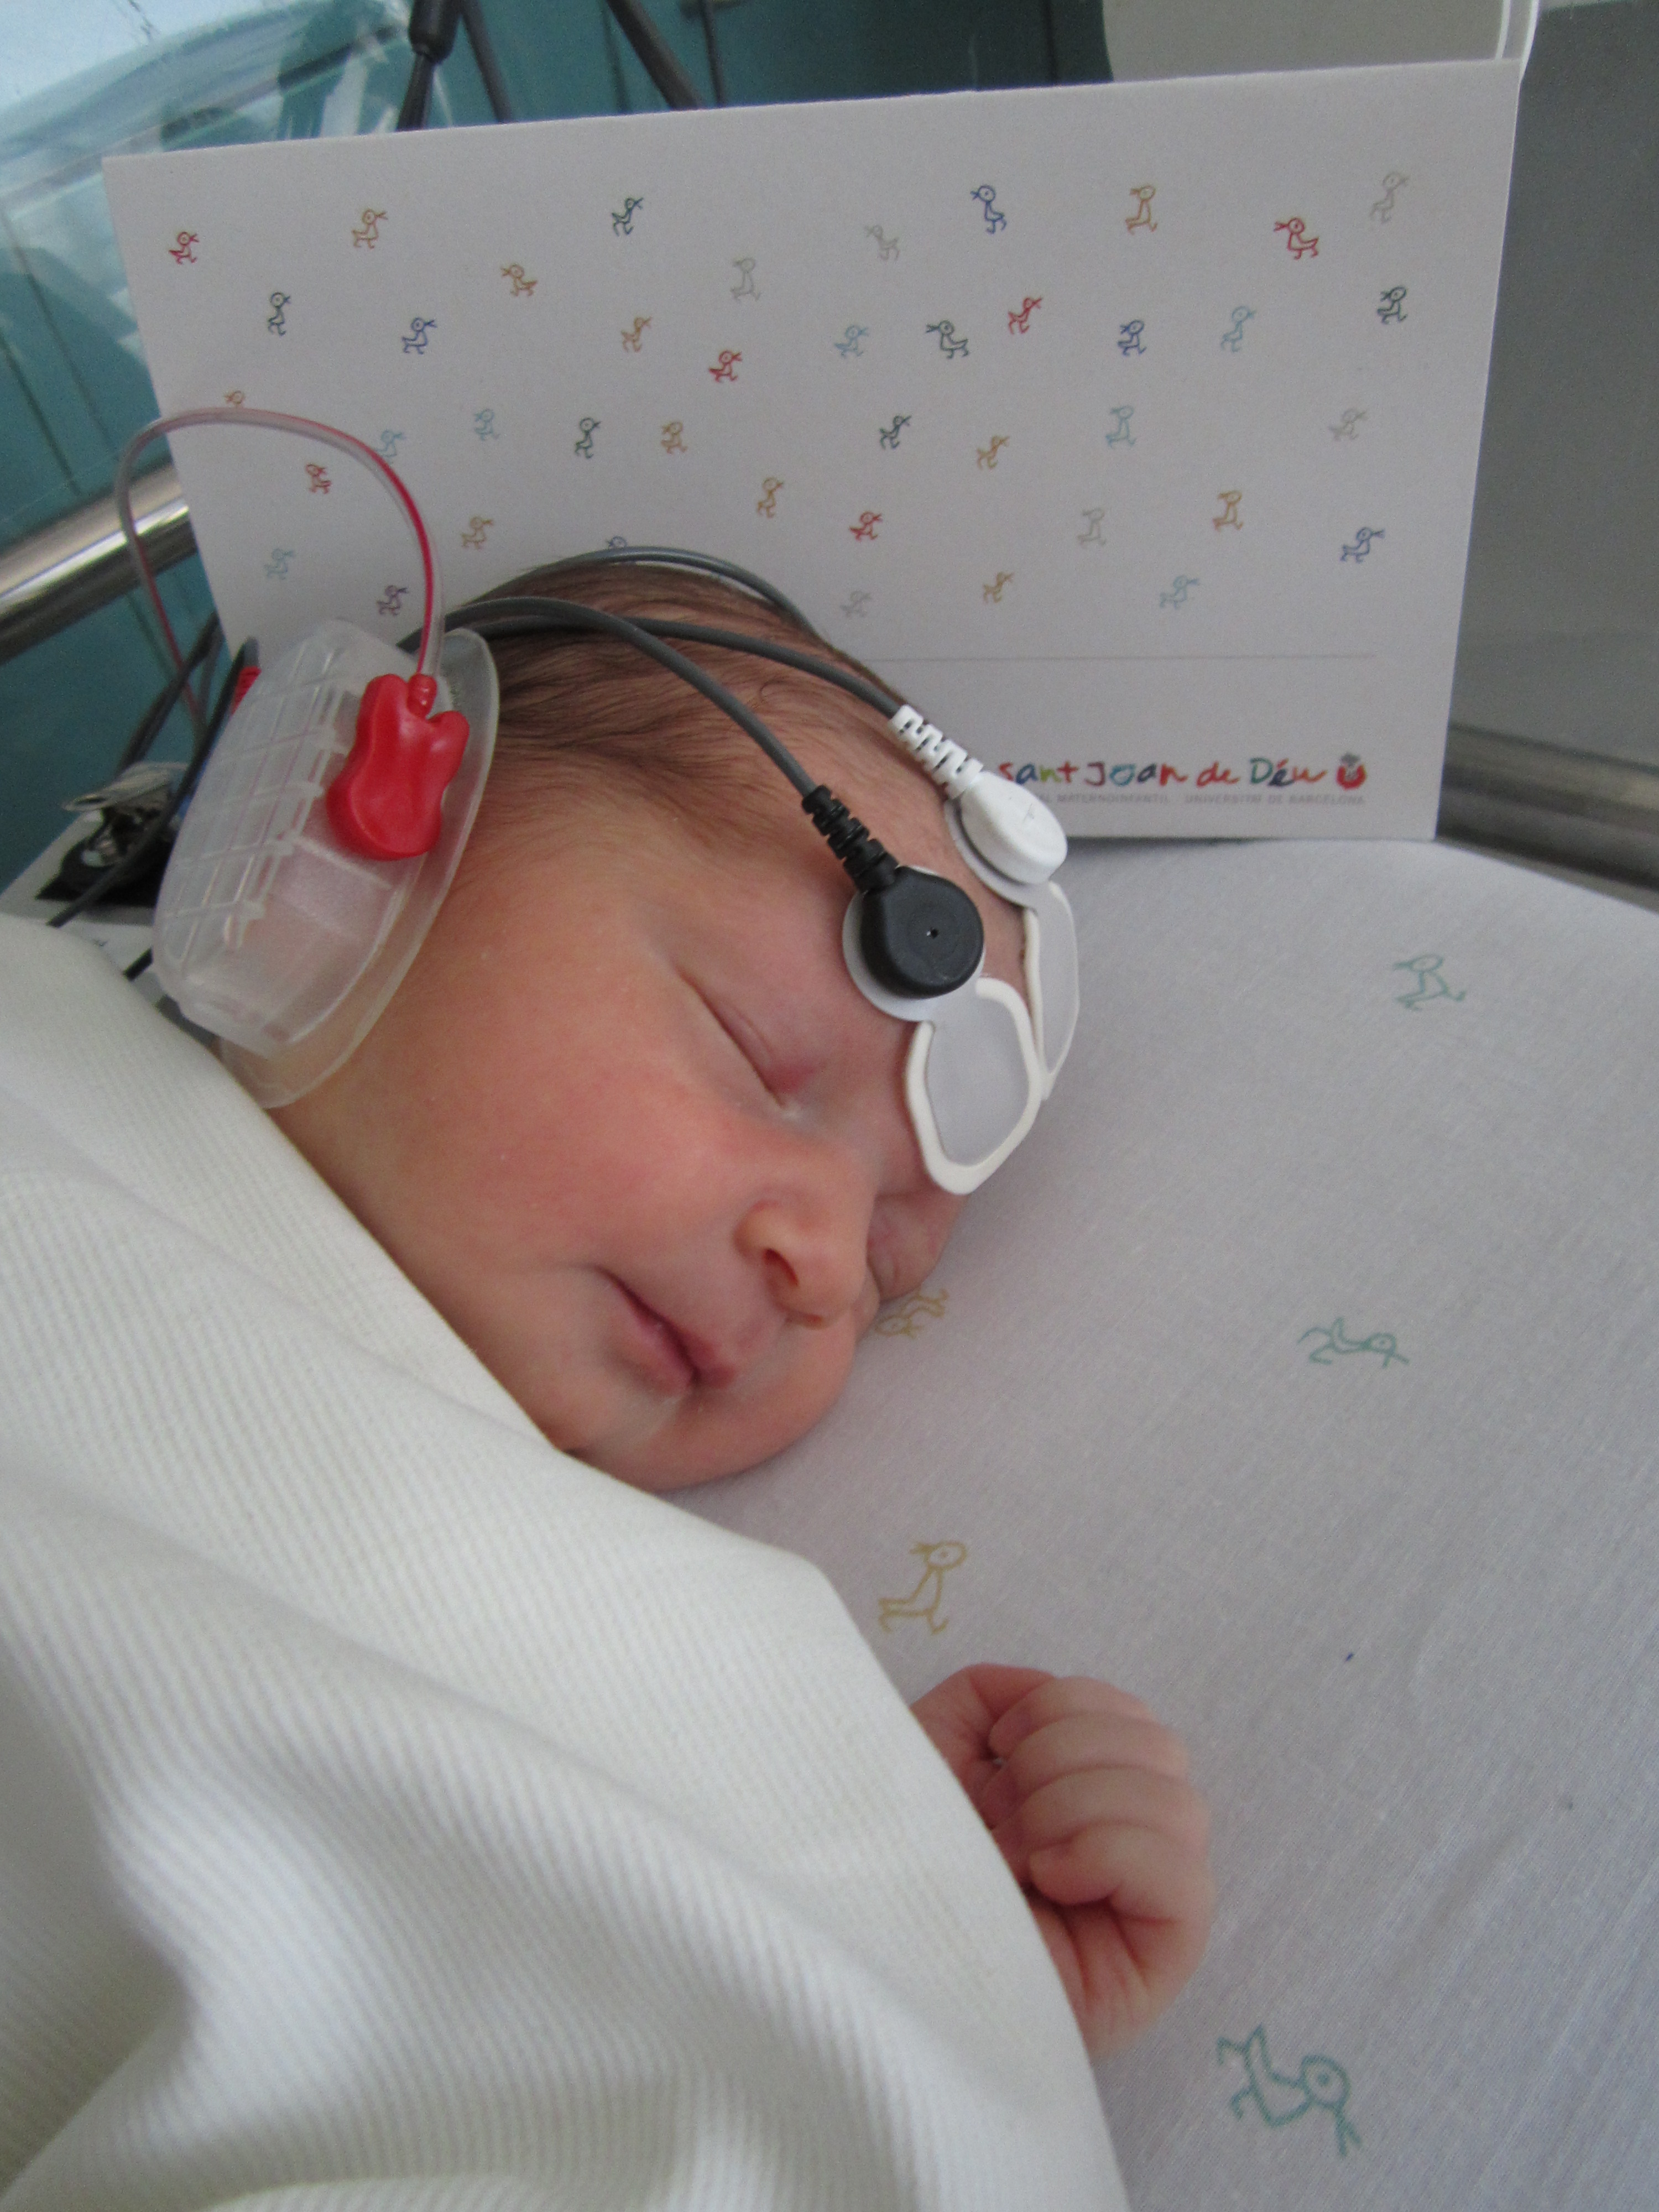
For that, we are recording the FFR in newborns during the first 72 hours of life, in the hospital room of the Woman’s Area after the universal newborn hearing screening has been passed, and a normative database will be published soon (Figures 1-3).
The research program is ambitious, as it involves: a) establishing the optimal speech stimuli to address different encoding challenges (e.g., speech in noise, consonant discrimination, pitch tracking), b) establishing the optimal recording parameters (e.g., number of sweeps, ear of stimulation, etc.), c) identifying the genetic, metabolic and environmental factors that shape the neonatal FFR, d) characterizing the normal and pathological development of the FFR, and c) assessing the FFR’s potential as biomarker of neurodevelopmental impairment, for example in babies born with fetal growth restriction.
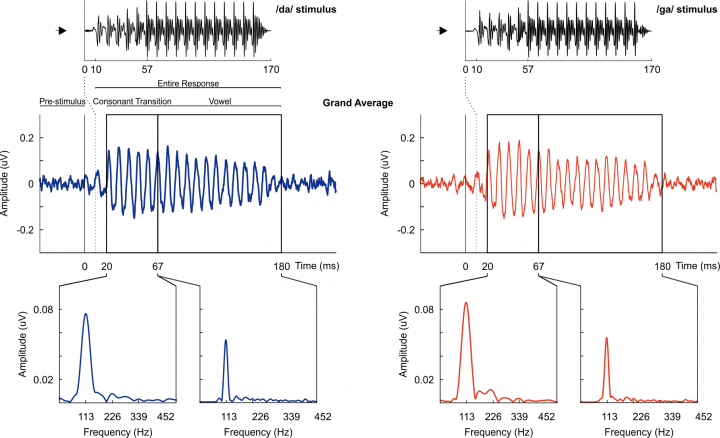
Figure 1. The neonate Frequency-Following Response (FFR) elicited to a /da/ (left) and /ga/ (right) syllable of 170 ms long. The top plot shows the stimuli, the middle plot shows the grand-average over N=46 newborns for /da/ (blue) and /ga/ (red), and the bottom plot depicts the spectrum of the transient and steady part of the response for the two stimuli. From Ribas-Prats et al. (in preparation).

Figure 2. Individual FFR recordings in six newborns, three having a clear response (left) and three displaying a noisy response (right). From Ribas-Prats et al. (in preparation).
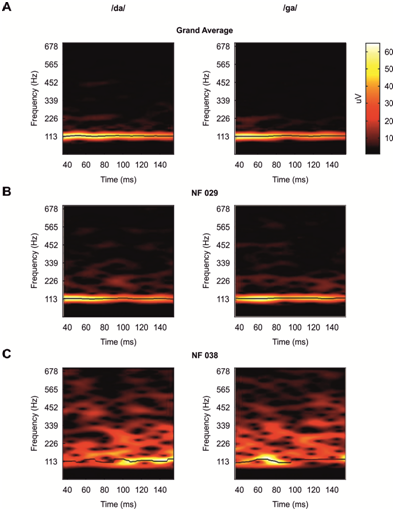
Figure 3. Spectrogram of the FFRs elicited to /da/ and /ga/ stimuli. A) the grand-averaged spectrogram, B) a newborn with high signal-to-noise ratio, C) a newborn with low signal-to-noise ratio. From Ribas-Prats et al. (in preparation).