

PI: Carles Escera
How does the auditory system make sense out of the myriad of sounds out there? One working hypothesis is that the auditory systems extracts regularities from the ongoing auditory input, and makes predictions of what we should expect hearing based on what we have recently heard (predictive coding)…, a hypothesis that built partially upon studies recording from the human scalp the Mismatch Negativity (MMN) event-related brain potential elicited to “deviant” sounds mismatching auditory predictions.
Here at the Brainlab, we have shown that unexpected rare auditory stimuli trigger a change detection process starting as early as 20 ms from acoustic change onset (Grimm et al., 2011; Figure 1), as revealed by an enhancement of the Nb waveform of the auditory Middle Latency Response (MLR). This process is based on the encoding of the acoustic regularity, on which temporal information plays a critical role (Costa-Faidella et al., 2011), and it is distributed in recurrent regions of the auditory cortex (Recasens et al., 2014; Figure 2) and spans the whole auditory hierarchy. Thus, we demonstrated the involvement of the human inferior colliculus in auditory deviance detection (Slabu et al., 2012; Figure 3; Cacciaglia et al., 2015; Figure 4).
These results, together with further research from our lab and the existence of the so-called novelty neurons along the auditory pathway has led us to propose that novelty detection, based on regularity encoding, is a pervasive property of the auditory system, expanding from lower levels in the auditory hierarchy to high-order areas of the auditory cortex (Escera & Malmierca, 2014; Escera et al., 2014). Confirmation of this proposal has come recently in a study conducted in collaboration at the Auditory Neurophysiology Lab of Prof. Manuel S. Malmierca of University of Salamanca, which showed a hierarchical emergence of prediction error along the auditory pathway.
![[Figure 1] The typical paradigm used in our experiments implements oddball, reversed oddball and control conditions. The auditory evoked potentials in the middle latency response revealed enhanced Nb components for deviant stimuli in comparison to both standard and control stimuli. Adapted from Grimm et al. (2011).](http://www.ub.edu/brainlab/wp-content/uploads/2014/07/Pr_1_f11.jpg)
Figure 1. The typical paradigm used in our experiments implements oddball, reversed oddball and control conditions. The auditory evoked potentials in the middle latency response revealed enhanced Nb components for deviant stimuli in comparison to both standard and control stimuli. Adapted from Grimm et al. (2011, Psychophysiology).
![[Figure 2] Thresholded grand-mean pseudo-Z activity (Deviant minus reverse standard) for Nbm (upper two rows) and MMN (lower two rows) after nonparametric cluster-based analysis. Significant voxels (P<0.01, corrected) are projected to the surface of a normalized MRI. Adaptaded from Recasens et al. (2014).](http://www.ub.edu/brainlab/wp-content/uploads/2014/07/Pr_1_f2.jpg)
Figure 2. Thresholded grand-mean pseudo-Z activity (Deviant minus reverse standard) for Nbm (upper two rows) and MMN (lower two rows) after nonparametric cluster-based analysis. Significant voxels (P<0.01, corrected) are projected to the surface of a normalized MRI. Adaptaded from Recasens et al. (2014, Cerebral Cortex).
![[Figure 3] The frequency following response (FFR) elicited to a /ba/ consonant-vowel stimuli presented in the roles of standard, deviant and control stimuli, in corresponding oddball, reversed oddball and control blocks. The Fourier transform of the response revealed an attenuated amplitude of the second harmonic (H2) of the response for the deviant stimuli, compared to both the standard and control stimuli. Adapted from Slabu et al. (2012).](http://www.ub.edu/brainlab/wp-content/uploads/2014/07/Pr_1_f3.jpg)
Figure 3. The frequency following response (FFR) elicited to a /ba/ consonant-vowel stimuli presented in the roles of standard, deviant and control stimuli, in corresponding oddball, reversed oddball and control blocks. The Fourier transform of the response revealed an attenuated amplitude of the second harmonic (H2) of the response for the deviant stimuli, compared to both the standard and control stimuli. Adapted from Slabu et al. (2012, J Neurosci).
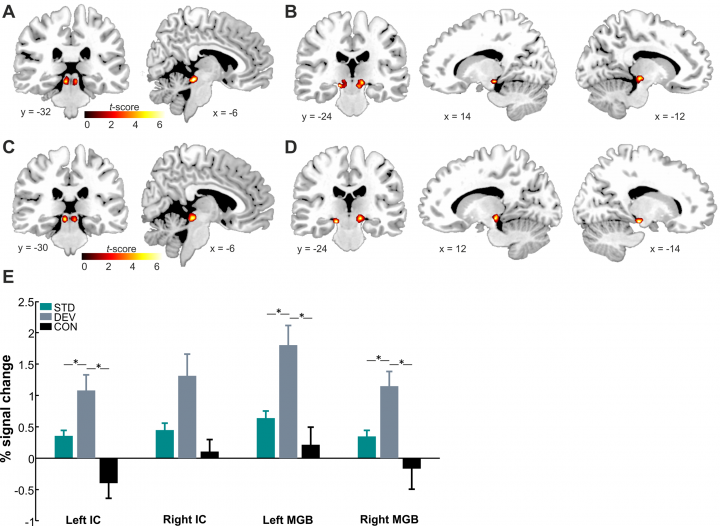
Figure 4. Auditory deviance detection in human midbrain a thalamic structures revealed by significant activation (FWE corrected at p > 0.05) in deviant-standard and deviant-control condition. From Cacciaglia et al. (2015; Neuropsychologia).
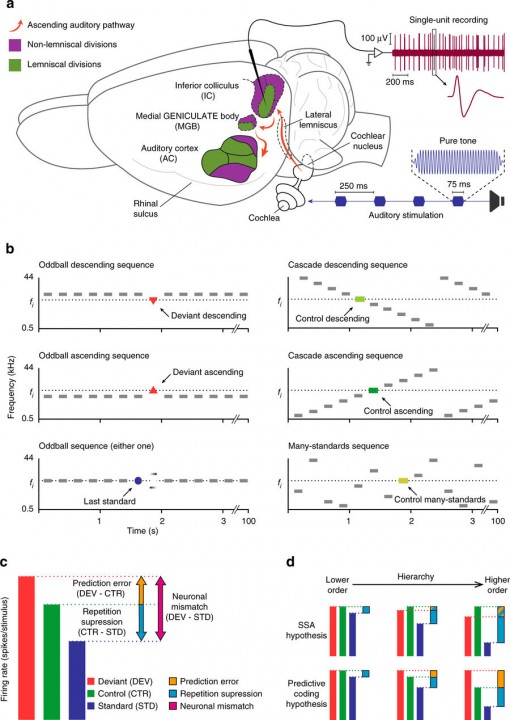
Figure 5. With this experimental setup, we demonstrated that prediction error emerges gradually along the auditory hierarchy. a) Experimental setup. b) Stimulation sequences. c) Decomposition of neuronal mismatch responses (DEV−STD) to the oddball sequence using either one of the control conditions. Under the assumption of predictive coding, CTR−STD (if positive) represents repetition suppression, and DEV−CTR (if positive) represents prediction error. d) Two hypothetical scenarios according to two possible competing mechanisms accounting for the neuronal mismatch: SSA (top) and predictive coding (bottom). For SSA, there is response suppression to the standard (blue bars), which progressively increases from lower order to higher order. In addition, due to suppression of the deviant relative to control, the prediction error is increasingly negative (blue and orange bars) as one progresses to higher-order regions. For predictive coding, repetition suppression of the standard (blue bars) increases from lower to higher-order regions. Unlike SSA, responses to deviants are higher than controls, especially in higher-order regions, leading to a positive prediction error (orange bars). From Parras et al. (2017, Nature Comm.).
This research was supported by the Spanish Ministry of Economy and Knowledge MINECO/FEDER PSI2012-31174).