Municipal waste
Description
Quantity of municipal waste, total and by fractions, generated in the different UB centers. These statistics include both the daily kilograms generated from each fraction, as well as the overall percentage of the selective collection fractions (organic waste, paper/paperboard, packaging and glass).
| Indicator | 2018 | 2019 | 2020 | 2021 | 2022 | Evolution |
|---|---|---|---|---|---|---|
| Rest | 2.791 | 2.436 | 1.043 | 2.004 | 2.877 | |
| Organic material | 766 | 973 | 328 | 471 | 769 | |
| Paper/cardboard | 1.722 | 1.476 | 641 | 1.367 | 1.494 | |
| Lightweight packaging | 200 | 257 | 109 | 197 | 219 | |
| Glass | 504 | 692 | 317 | 576 | 619 | |
| TOTAL | 5.983 | 5.834 | 2.438 | 4.615 | 5.978 | |
| Selective collection (%) | 53,3 | 58,2 | 57,2 | 56,6 | 51,9 |
Results
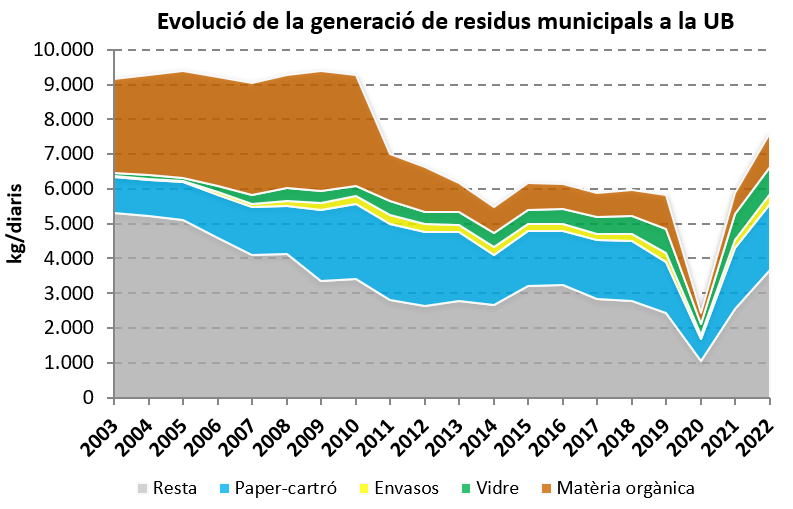
Between 1998 and 2009, the UB experienced a significant improvement in the recovery of raw materials and the saving of natural resources involved in waste recycling. Thus, while in 1998 only paper was collected separately, and up to 86% of the waste was disposed of in the waste fraction, in 2010 more than 60% of the municipal waste generated at the UB was recycled. Between 2010 and 2014 there was a reduction in the amount of waste generated, reaching 5.5 tons per day. Part of this reduction is explained by a decrease in activity, and another part by a change in the methodology used to calculate the waste generated.
Since 2015 the total amount has been decreasing from 6.1 to 5.8 tons per day. By fractions:
- paper-cardboard is found at around 1.5 tons per day, with some amounts reaching up to 1.7 tons,
- organic waste was 0.75 tons per day when the collection was limited to bars, but the implementation of selection in the areas where people eat in lunchboxes has allowed to increase this fraction by 250 kg per day;
- light packaging is around 200 kg per day, with an increase in 2019 to almost 260 kg;
- glass was between 400 and 500 kg per day, but in 2019 there will be an increase to almost 700 kg.
The selective collection has improved significantly since 2016, and is now close to 60%. Most of the selection corresponds to paper-metal (25% in weight of the total municipal waste), which is the predominant waste at the University, but the fraction of organic matter is also very significant (17%). The fractions of light packaging (4%) and glass (12%) are in the minority.
The data for 2020 were estimated based on 2019 values, taking into account the period of activity shutdown, the fact that restoration services have been shut down for more than nine months, and the variable attendance during the different phases of de-escalation due to the COVID-19 pandemic. Overall, a reduction of 58.2% of the total amount of municipal waste generated is estimated. The year 2021 is also affected by the pandemic, with catering and reprographics services closed until September.
In 2022, for the first time, waste from the subtractive and paper-cartridges fractions, which are managed by other means than municipal collection, were incorporated. This negatively affects the total waste generated, which increased by 29.5% compared to the previous year, and reduces the proportion of waste collected selectively, since the increase is concentrated in the remaining fraction.
Charts
Hazardous Waste
Description
Quantity of special waste produced by the laboratories of the different UB centers, expressed in kilograms, and managed by companies authorized by the Waste Agency of Catalonia.
This statistic includes chemical waste (liquids and solids), sanitary waste (biohazardous and cytotoxic), photographic waste (developers and fixers) and waste from experimental animals generated at Animal Experimentation Units (Stables).
| Indicator | 2018 | 2019 | 2020 | 2021 | 2022 | Evolution |
|---|---|---|---|---|---|---|
| Total amount | 86.921 | 88.262 | 54.930 | 81.608 | 73.725 | |
| Chemical waste | 46.317 | 52.287 | 32.954 | 53.287 | 51.969 | |
| Sanitary waste | 27.914 | 28.461 | 14.989 | 18.610 | 15.374 | |
| Animal waste | 12.690 | 7.514 | 6.987 | 9.711 | 6.382 |
Results
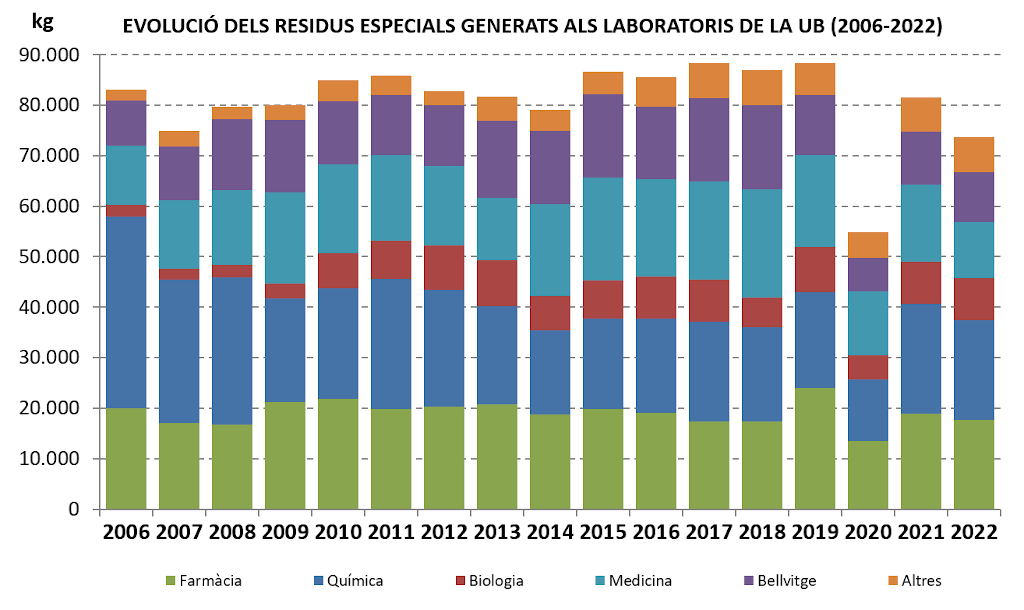
Between 2010 and 2013, the indicator showed a decrease of around 7%, due, on the one hand, to the termination of research projects and the lack of new funding for R&D&I activities, but also to the fact that actions were implemented to prevent the generation of special waste.
Between 2013 and 2015 there was a further increase of 13%, caused by the increase in healthcare waste. In fact, in this period chemical waste decreased by 11.6%, while sanitary waste increased by 48%. This increase is associated with the start-up of new laboratories belonging to external institutions which, by working in UB facilities, have a significant impact on the total volume of special waste.
Since 2015, the total amount has remained more or less stable, but each type of waste has behaved differently: chemical and photographic waste has been fluctuating, sanitary waste has been gradually increasing and animal waste has been decreasing. There was an increase in chemical waste in 2019, mainly due to a fire in one of the buildings’ research facilities, which left a large quantity of reagents unusable and had to be managed as waste.
The production of waste in 2020 will decrease by 38% as a result of the temporary closure of buildings due to the COVID-19 pandemic. In 2021 the values increase again, but they are still 7.5% lower than in 2019.
By centres, the main generators are the Faculty of Chemistry, the Faculty of Medicine-Clinic, the Faculty of Pharmacy and the Bellvitge Campus.
Charts
Other waste
Description
Quantity of special municipal waste (electronic equipment fractions, batteries, fluorescent bulbs, and ink cartridges and toners), collected separately at the UB’s different centres.
| Indicator | 2018 | 2019 | 2020 | 2021 | 2022 | Evolution |
|---|---|---|---|---|---|---|
| Electronic equipment (kg) | 10.888 | 9.421 | 10.923 | 19.483 | 15.155 | |
| Batteries (kg) | 646 | 647 | 278 | 555 | 197 | |
| Fluorescent (kg) | 1.637 | 1.993 | 1.233 | 1.502 | 1.424 | |
| Ink cartridges and toners (kg) | 2.531 | 2.381 | s.d. | 341 | 807 |
Results
The waste included in this section shows a variable trend, as detailed below:
- Electronic equipment. There is a significant year-on-year variation, as there is no regularity in collections and the waste is centralised and stored for a period of time while waiting to be collected. In 2015 and 2017, there were two re-stockings, which coincided with an important campaign to replace the rental equipment. Between 2018 and 2020 the amount of waste managed will be around 10 tonnes. In 2021 and 2022 the quantity managed increased again to almost 20 tonnes, largely as a result of collections at some centres that had been storing material for several years.
- Batteries. As with electronic equipment, the collection of batteries is not periodic, and this explains the variation in the quantities generated from year to year. However, there was a decreasing trend between 2011 and 2014, and a new increase from 2015 onwards. From 2019 onwards, the values will vary greatly depending on factors such as the decrease in the quantities accumulated in some centers (Mundet Campus, Physics and Chemistry faculties, and Baldiri Reixac Library, among others), the covid-19 pandemic, which will affect collections in 2020, and a gradual decrease that may be the result of a reduction in the use of batteries in favor of rechargeable batteries.
- Fluorescents. Since the second half of 2008, UB faculties and schools have been integrated into the system for the management of lamp waste, with their own containers and the fact that all the fluorescent bulbs generated are collected by one of the companies authorised by the Catalan Waste Agency. Annual values are between 1.4 and 1.9 tons. A progressive reduction is foreseen as the luminaires become LED type, with a longer useful life.
- Ink cartridges and toners. It includes data on equipment toner waste in the UB’s administrative units, reprographic services in each centre, and self-service photocopiers (until 2017, when the service was abolished). The management procedure for this waste was consolidated and stabilized, with an annual amount collected between 2.1 and 2.5 tons. The entry into operation of the printing contract, which entails a reduction in the number of equipment and a standardisation of consumables, also generates a reduction in waste, although it is still too early to determine in what proportion.
The COVID-19 pandemic of 2020 has affected the generation of this waste in a different way. The management of WEEE has remained practically unchanged, as obsolete equipment has continued to be managed in similar quantities. There has been a 57% reduction in the number of bins due to the fact that the UB acts as a public collection point, and attendance at the buildings has been reduced due to mobility restrictions. Fluorescent waste has fallen by 38% due to the reduced use of lights in buildings, with a total shutdown during some weeks and less presence in offices. At the date of updating of this file, the data corresponding to the collections made in 2020 were not available.