Positions of all the particles with St = 1.2 (left panel) and St = 4.9 (right panel) within a thin slice of thickness equal to 2% of the computational box. Density fluctuations are much stronger for particles with St = 1.2 than for those with St = 4.9, but this cannot be fully appreciated from the images, due to the overlap of particle positions. Notice the very small scale structures present in the spatial distribution of the St = 1.2 particles. Dense particle filaments and large voids can be seen in both panels, with sizes approaching the integral length of the flow, estimated to be approximately 0.2 times the computational box size. The estimated size of the dissipation scale, η, is approximately 10−3 times the box size.
Particle Clustering versus Stokes Number
St=1.2 St=4.9
Animation of Particle Slices
Motion through slices of St = 0.16 particles. Each slice has a thickness equal to 1% of the computational box (or 10 times the dissipation scale, η).
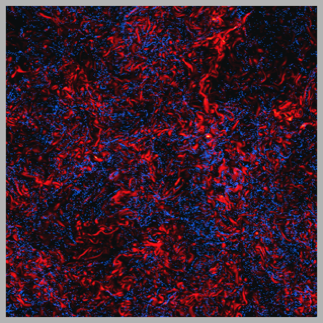
Flow vorticity on a slice of the simulation box. The thickness of the slice is two computational zones. The color scale is linear with vorticity, and the red color represents high vorticity values. Blue dots are locations of particles with St = 1.2. A clear anti-correlation is seen between the vorticity field and the particle positions.
Vorticity-Clustering Anticorrelation