Description
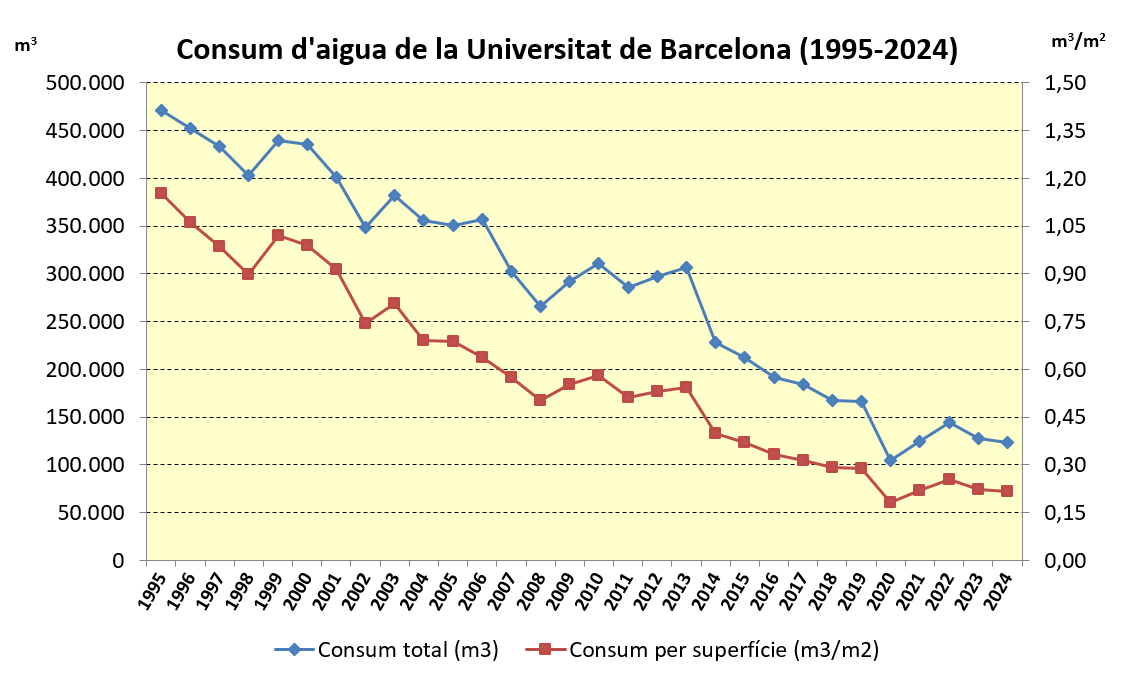
Amount of water consumed in the buildings of the University of Barcelona in different uses (sanitation, cleaning, garden irrigation, showers, laboratories, workshops, etc.)
| Indicator | 2020 | 2021 | 2022 | 2023 | 2024 | Evolution |
|---|---|---|---|---|---|---|
| Total UB consumption (m³) | 105.227 | 124.491 | 145.005 | 127.826 | 123.192 | |
| Consumption per unit area (m³ / m²) | 0,18 | 0,22 | 0,25 | 0,22 | 0,21 |
Results
Total water consumption at the University of Barcelona has decreased by 73% between 1995 and 2023, with several particularly significant reductions:
- 24% between 2006 and 2008 as a result of the savings measures implemented and the greater degree of awareness in the use of water during the drought period that took place in Catalonia in 2007 and the first months of 2008.
- 45% between 2013 and 2018, thanks to greater control and monitoring of the consumption of each building, from the Maintenance Unit, which allows to detect leaks in facilities more quickly, and the implementation of various actions to restrict the consumption of irrigation water or in cooling towers.
- 25% between 2019 and 2021, due to the covid-19 pandemic and its effects on face-to-face activity.
- 15 % between the years 2022 and 2024 due to the measures derived from the drought decree, where during exceptional and pre-emergency states the watering of gardens and grassland areas will be restricted, and the awareness campaign ‘Water does not fall from the sky’.
We cannot ignore, however, the gradual increase in consumption experienced from 2008 to 2010, when the austerity measures implemented during the drought relaxed.
More information available in the news about energy and water consumption .