Description
Greenhouse gas emissions, expressed in tons of CO₂ equivalent, in the areas of activity inventoried at the University of Barcelona.
| Indicator | 2020 | 2021 | 2022 | 2023 | 2024 |
|---|---|---|---|---|---|
| OVERALL EMISSIONS | 15.419,4 | 24.754,6 | 35.055,1 | 34.725,6 | 40.251,6 |
| DIRECT EMISSIONS | 3.266,8 | 3.947,7 | 3.768,8 | 2.881,9 | 2.840,4 |
| Combustion from stationary sources (gas) | 2.038,4 | 2.769,1 | 2.372,2 | 1.888,2 | 1.641,6 |
| Combustion mobile sources (own vehicles) | 19,6 | 41,1 | 37,4 | 45,0 | 39,9 |
| Fugitives (refrigerants) | 1.208,8 | 1.137,5 | 1.359,2 | 948,7 | 1.158,9 |
| INDIRECT EMISSIONS | 12.152,5 | 20.806,9 | 31.286,3 | 31.843,7 | 37.410,9 |
| Acquired energy (electricity) | 0,0 | 130,4 | 0,0 | 0,0 | 0,0 |
| Distribution transport | 4,3 | 5,2 | 4,7 | 3,7 | 3,6 |
| In itinere transport (PTGAS and PDI) | 2.094,8 | 2.929,4 | 9.520,9 | 8.625,5 | 8.558,2 |
| Transport of clients and visitors (students) | 4.516,2 | 11.716,5 | 13.557,1 | 12.897,3 | 12.765,7 |
| Business trips | 166,9 | 288,9 | 1.619,5 | 1.629,7 | 2.497,3 |
| Municipal waste treatment | 140,8 | 327,0 | 327,0 | 518,4 | 518,1 |
| Treatment of other waste | 11,2 | 85,1 | 16,1 | 18,0 | 15,7 |
| Water consumption | 11,2 | 49,6 | 58,8 | 51,7 | 67,1 |
| Cloud services | * | * | 71,6 | 67,5 | 59,6 |
| Suppliers | * | * | * | 2.293,7 | 6.398,2 |
| Purchase of materials and products (paper) | 33,0 | 42,2 | 91,2 | 90,5 | 103,8 |
| Acquired electricity production | * | * | 966,2 | 860,3 | 865,1 |
| Capital goods (construction of buildings) | 5.142,3 | 4.389,3 | 4.410,1 | 4.409,5 | 4.420,7 |
| Capital goods (electronic equipment) | * | 843,4 | 388,9 | 377,8 | 1.137,9 |
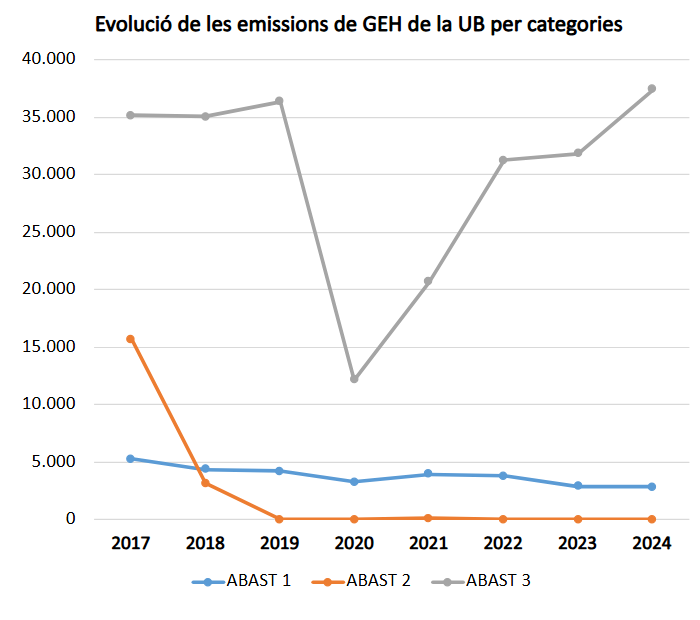
| Year | Scope 1 | Scope 2 | Scope 3 | Total |
|---|---|---|---|---|
| 2017 | 5,269.8 | 15,688.5 | 35,157.0 | 56,115.3 |
| 2018 | 4,356.9 | 3,185.7 | 35,072.4 | 42,614.9 |
| 2019 | 4,232.8 | 0.0 | 36,349.8 | 40,582.6 |
| 2020 | 3,266.8 | 0.0 | 12,152.5 | 15,419.4 |
| 2021 | 3,947.7 | 130.4 | 20,676.5 | 24,754.6 |
| 2022 | 3,768.8 | 0.0 | 31,286.3 | 35,055.1 |
| 2023 | 2,881.9 | 0.0 | 31,843.7 | 34,725.6 |
| 2024 | 2,840.4 | 0.0 | 37,410.9 | 40,251.3 |
Direct emissions correspond to those of scope 1, and indirect emissions to the sum of those of scope 1 and scope 2.
Results
The University of Barcelona carries out an inventory of its greenhouse gas emissions as a member of the Voluntary Emission Reduction Agreement Programme of the Catalan Office for Climate Change of the Government of Catalonia.
Total emissions have been significantly reduced during this period, mainly thanks to the contracting of electricity from renewable sources, the progressive reduction of energy and water consumption, and the implementation of measures to reduce waste generation, improve waste separation and reduce paper consumption. The emissions associated with the refilling of refrigerant gases in the air conditioning equipment have been stable for the last five years, and are derived from the maintenance of the existing equipment.
Emissions related to commuting transport (PDI and PTGAS) and customers and visitors (students) reflect the effects of the COVID-19 pandemic in 2020 and 2021. However, emissions due to the mandatory mobility of the university community in 2022 and beyond are nearly 20% lower than those in 2019.
Progressively, new components have been incorporated into the inventory, to comply with the UNE-EN ISO 14064-1:2019 methodology. Starting in 2018, business trips began to be calculated, from 2020 the treatment of other waste, from 2022 cloud services and the production of purchased electricity, and from 2023 trips for international student mobility programs and emissions from UB suppliers. These new components have been adding emissions to the inventory that make comparison difficult since the beginning of the time series (2017), adding about 11,000 tons of CO₂ equivalent.