Description
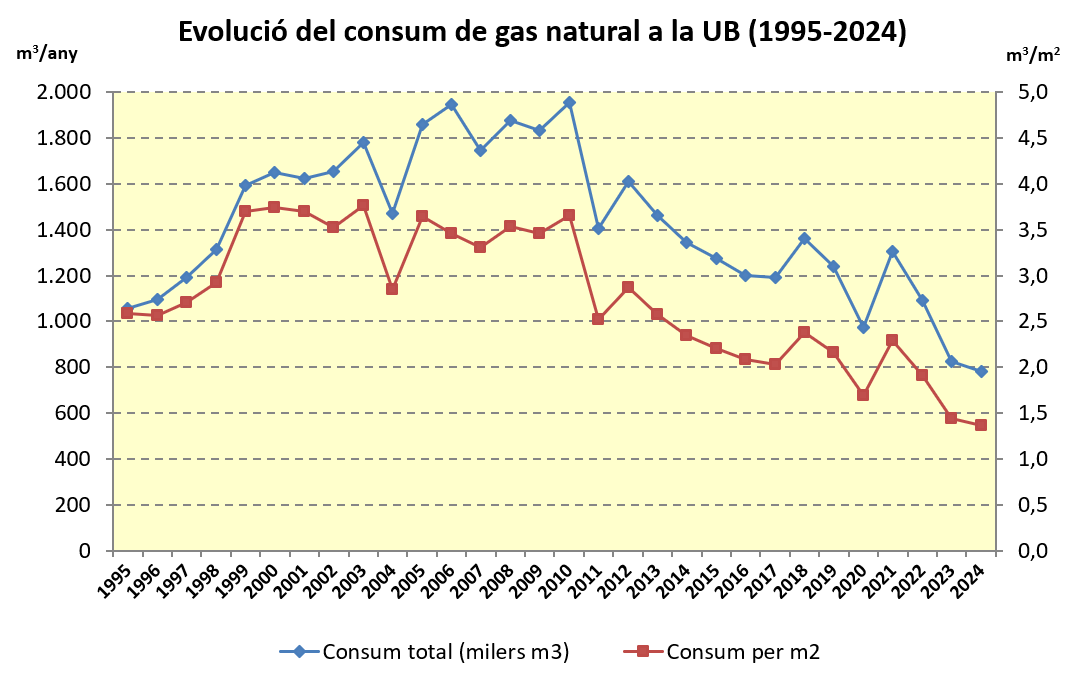
Amount of natural gas consumed in the buildings of the University of Barcelona in different uses (laboratories, kitchens, heating, etc.)
| Indicator | 2020 | 2020 | 2021 | 2022 | 2023 | Evolution |
|---|---|---|---|---|---|---|
| Total consumption UB (thousand m³) | 974,7 | 1.304,1 | 1.092,3 | 825,1 | 781,8 | |
| Consumption per unit area (m³ / m²) | 1,70 | 2,29 | 1,91 | 1,44 | 1,37 |
Results
From 1995 to 2010, natural gas consumption clearly followed an upward trend, as the decline in 2004 is not significant as the data do not correspond to actual billing but to estimates. The increases occur in cycles (1995-1999 and 2002-2006), separated by stabilized consumption periods (1999-2002 and 2006-2010).
The period 2010-2017 breaks this dynamic, and gas consumption decreases by 39% compared to 2010 thanks to the control measures of the heating carried out by the Maintenance Unit in collaboration with the center administrations, as well as for a few winters with mild temperatures.
The reduction in 2020, with 22% less consumption than in the previous year, reflects the cessation of activity for some weeks due to the Covid-19 pandemic. The year 2021, with a relative recovery of normal activity, implies a return to forecast consumption, bearing in mind that heating in winter meets the need for continuous ventilation of the building’s interior spaces.
The downward trend will continue in 2023 and 2024 thanks to the energy saving measures implemented within the framework of the Plan to promote energy saving at the University of Barcelona , including the communication campaign ” We are responsible “. Between 2020 and 2024, gas consumption has decreased by 28.4%.
More information available in the news about energy and water consumption .